4 Sinusoid graph:
---------------------------------------------
from pylab import *
#Define constantsConstants
A=1 #Define the ampletude of the sin function
w=1 #sets the frequancey coefficient
#Calculation Loop: Note Nesting Carfully
for i in range(1,4):
x = []
sin_list = []
for t in arange (-3.14, 3.14, 0.01):
sine= A*sin(i*w*t)
sin_list.append(sine)
x.append(t)
plot (x,sin_list)
show()

---------------------------------------
50 sinusoid graph:
--------------------------------------
from pylab import *
#Define constantsConstants
A=1 #Define the ampletude of the sin function
w=1 #sets the frequancey coefficient
#Calculation Loop: Note Nesting Carfully
for i in range(1,50):#every time the loop repeats this will change the harmonic
x = [] # plots from -pi to +pi
sin_list = [] #this includes the sine functions
for t in arange (-3.14, 3.14, 0.01): # create tsh range of the graph and incriments
sine= A*sin(i*w*t) #the function to be plotted
sin_list.append(sine) # Adds the calculated vale from the sine function to the list appendex
x.append(t)
plot (x,sin_list)# plots values
show() #show the plot


----------------------------------------
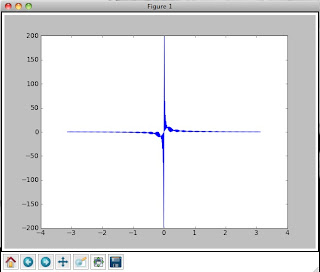
Localized particle
---------------------------------------
from pylab import *
#Define constantsConstants
A=1 #Define the ampletude of the sin function
w=1 #sets the frequancey coefficient
Fourier_Series=[] #initialize the list of sine functions
#Calculate the harmonics of the sine functions
for i in range(1,300):#every time the loop repeats this will change the harmonic
x = [] # plots from -pi to +pi
sin_list = [] #this includes the sine functions
for t in arange (-3.14, 3.14, 0.01): # create tsh range of the graph and incriments
sine= A*sin(i*w*t) #the function to be plotted
sin_list.append(sine) # Adds the calculated vale from the sine function to the list appendex
x.append(t)
#plot (x,sin_list)# plots values
Fourier_Series.append(sin_list)
superposition = zeros(len(sin_list))
for function in Fourier_Series:
for i in range(len(function)):
superposition[i]+=function[i]
plot(x,superposition)
show()

--------------------------------------------
Envelope
-------------------------------------------
from pylab import *
#Define constantsConstants
A_list=[] #Define the amplitude of the sin function
w=1 #sets the frequancey coefficient
Fourier_Series=[] #initialize the list of sine functions
sigma = 1
coeff = 1
numberofharmonics=50
center = numberofharmonics/2
#Calculate the harmonics of the sine functions
for i in range(1,50):#every time the loop repeats this will change the harmonic
x = [] # plots from -pi to +pi
gauss = coeff*exp(-(i-center)**2/(2.*sigma**2))
sin_list = [] #this includes the sine functions
for t in arange (-3.14, 3.14, 0.01): # create tsh range of the graph and incriments
sine= gauss*sin(i*w*t) #the function to be plotted
sin_list.append(sine) # Adds the calculated vale from the sine function to the list appendex
x.append(t)
#plot(x,sin_list)# plots values
#show()
Fourier_Series.append(sin_list)
superposition = zeros(len(sin_list))
for function in Fourier_Series:
for i in range(len(function)):
superposition[i]+=function[i]
plot(x,superposition)
show()


---------------------------------------------------
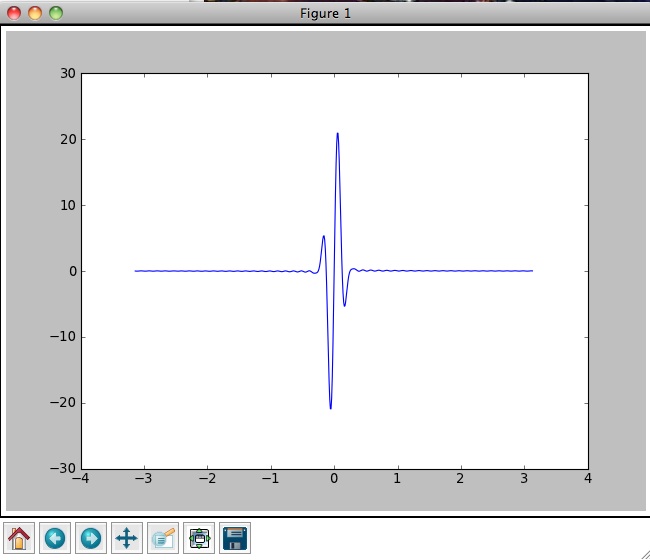
Wave packet
---------------------------------------------------
from pylab import *
#Define constantsConstants
w=1 #sets the frequancey coefficient
Fourier_Series=[] #initialize the list of sine functions
sigma = 10
coeff = 1
numberofharmonics=50
center = numberofharmonics/2
#Calculate the harmonics of the sine functions
for i in range(1,50):#every time the loop repeats this will change the harmonic
x = [] # plots from -pi to +pi
gauss = coeff*exp(-(i-center)**2/(2.*sigma**2))#Define the amplitude of the sin function
sin_list = [] #this includes the sine functions
for t in arange (-3.14, 3.14, 0.01): # create tsh range of the graph and incriments
sine= gauss*sin(i*w*t) #the function to be plotted
sin_list.append(sine) # Adds the calculated vale from the sine function to the list appendex
x.append(t)
#plot(x,sin_list)# plots values
#show()
Fourier_Series.append(sin_list)
superposition = zeros(len(sin_list))
for function in Fourier_Series:
for i in range(len(function)):
superposition[i]+=function[i]
plot(x,superposition)
show()

--------------------------------------------------
No comments:
Post a Comment