Sunday, September 25, 2011

Light Refraction Lab

Purpose:
The purpose of this experiment was to test the refraction of light through a class prism.  A light source was used with a circular protractor to measure the angle of refraction for the light source.


Method and Results:
A light source was set up with a focused beam of light.  A glass semi circle prism was set on a circular protractor and the light was focused into the prism at measured angles.  


First the light was incident to the strait diameter of the semicircle yielding these results.

theta i theta r sin(theta i) sin(theta r)
144 60 0.587 0.866
148 55 0.53 0.819
150 50 0.5 0.766
152 45 0.47 0.707
156 40 0.407 0.643
158 35 0.375 0.574
161 30 0.326 0.5
163 25 0.292 0.423
167 20 0.225 0.342
172 15 0.139 0.259


Next the light was focused incident to the arc of the semi circle giving data table # 2.

theta i theta r sin(theta i) sin(theta r)
124 30 0.829 0.5
135 25 0.707 0.423
149 20 0.515 0.342
152 15 0.469 0.259
167 10 0.225 0.174
174 5 0.105 0.087
180 0 0 0
190 -5 -0.174 -0.087
203 -10 -0.391 -0.174
211 -15 -0.515 -0.259


Conclusion:
When a graph of the two angles was taken, it was found to be linear, these results are not what was to be expected.  


A reason for both sets of theta vs. theta graphs incorrect equations is due to the fact that the results were not taken over a longer range of circular increments.  If the data was to be taken as every 10 degrees for 10 trials the results may have been less skewed.  The slope of the sin(O)1 vs sin(O)2 was taken to be the index of refraction which was 1.52 +/- .15. 

Sunday, September 18, 2011

Harmonic Overtones Lab


Method and Results:
Using a Pasco Variable Wave Driver and a Pasco Student Function Generator standing waves were created of known frequency on a string (f).  


The other end of the string was attached to a pulley and weighed down with known mass (M).  This mass (M) was multiplied by gravity to determine the tension on the string (T).  The total length of the string was measured (L) and the amount of nodes, (n), created in the standing wave were recorded with respect to frequency.  


The mass of the string was recorded and divided by its length to determine the mass per unit length (m).  This information was used to determine the wavelength of the wave at certain frequency. 

frequency muew Tension nodes Velocity Wavelength
16.0 1.88E-03 1.95902 2 37.5565 2.35
32.0 1.88E-03 1.95902 3 37.5565 1.17
46.0 1.88E-03 1.95902 4 37.5565 0.816
63.0 1.88E-03 1.95902 5 37.5565 0.596
76.0 1.88E-03 1.95902 6 37.5565 0.494
109.0 1.88E-03 1.95902 8 37.5565 0.345
frequency muew Tension nodes Velocity Wavelength
27.0 1.88E-03 0.98196 2 22.8543 0.846
32.0 1.88E-03 0.98196 4 22.8543 0.714
54.0 1.88E-03 0.98196 6 22.8543 0.423
     
frequency muew Tension nodes Velocity Wavelength
15.0 1.88E-03 3.92 2 45.663 3.04
29.4 1.88E-03 3.92 3 45.663 1.55
44.0 1.88E-03 3.92 4 45.663 1.04
54.4 1.88E-03 3.92 5 45.663 0.839
72.3 1.88E-03 3.92 6 45.663 0.632
100.3 1.88E-03 3.92 7 45.663 0.455


Conclusion: 
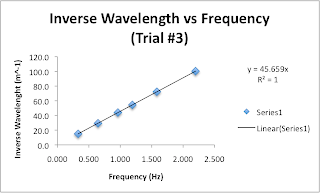
All data obtained was graphed and these graphs produced perfect linear equations when the inverse wavelength was taken and plotter with respect to the frequency. 


The slopes of each of these lines are the velocities of the waves on their respective strings.   When using a string with the same mass per length the frequency to obtain the same harmonic in different trials is directly proportional to the hanging mass used.

Friday, September 9, 2011

Standing Wave Lab

Purpose:
The purpose of this experiment was to investigate the relationship between the period of a standing wave (T) and its wavelength (L). 


Method and Results:
To achieve the desired data for this experiment a spring was secured and held at opposite ends so its frame was parallel with the ground.  The goal was to have both experimenters who held the opposite ends of the spring to apply an upward force in an attempt to create one standing wave. 


The length measured from one experimenter to the other was recorded as the wavelength (L).  Once the Standing wave was created a stopwatch was used to measure the elapsed time for ten complete cycles.  This time was then divided by ten too determine the period of one cycle (T)


At least two trials were taken at this length.  The experiment was next repeated at different lengths.  Averages were taken at each length and the results we graphed.

L (m)                                    T (1/s)                                    Average T (1/s)
2.76 +/- .06                       0.855            +/- .045                        0.871            +/- 0.225           
                                          0.834            +/- .045                                   
                                          0.902            +/- .045
                                          0.858            +/- .045
                                          0.904            +/- .045

2.51 +/- .06                        0.777            +/- .045                        0.761  +/-  0.135
                                           0.755            +/- .045
                                           0.751            +/- .045

3.17 +/- .06                        1.014            +/- .045                        1.027  +/-  0.135
                                           1.030            +/- .045
                                           1.036            +/- .045

1.43 +/- .06                        0.436            +/- .045                        0.423  +/-  0.090
                                          0.409            +/- .045

Conclusion:
When graphed the slope of the line is equal to the velocity the wave travels through the medium, in this case the spring.  This value was determined to be 3.179 m/s +/- 0.285 m/s.


This result proves that the velocity of the propagation of the wave is expressed in the equation.

v= L/T

Sunday, September 4, 2011

Fluid Dynamics (Flow of water out of bucket)


Objective:
The objective of this lab was to document how well the measured values of time agree with uncertainty, in order to properly prove the Bernoulli equation.

Method and Results:
A bucket that contained a drain hole on the bottom vertical wall was obtained and sealed with tape.  This Bucket was then filled with tap water up to a constant height.  Next a measurement was taken from the drain hole to the surface of the water (h)

h= 0.110 m  +/-  0.0012 m

The diameter of the drain hole was given and then measured for accuracy.  That value was then divided by two to determine the radius of the drain hole (r)

R*=  3.175e-3 m 
r = 3.675e-3  m +/-  1.5e-3 m

* given value

This value was used to determine the cross sectional area of the drain hole (A)

A= (pi)r^2= 4.24e-5 m  +/- 3.00e-3 m

A Graduated cylinder was placed under the drain hole to measure the volume of water that was emptied from the bucket (V)

V= 5.0e-4 m^3 +/- 1.5e-6 m^3


When the tape was removed from the drain hole a stopwatch was used to determine the amount of time (t) it took for the water to drain down the complete height (h)


                  Time to empty (s)
1st Run         20.30
2nd Run         19.74
3rd Run         19.87
4th Run          20.30
5th Run          20.89
6th Run          20.21

The acceleration due to gravity (g) was taken as a constant 9.8 m/s^2.  These values were used to calculate the theoretical value of time (T).

T= 8.03 s  +/-  5.40 s


Conclusion and Analysis:
                                                               Time (s)
Avg                                                                20.22                                   
Range                                                      1.15
Standard deviation                                    0.404        
Error %                                                      60 %                                   
Measured Uncertainty                           5.40
Calculated uncertainty                           4.82

Although the uncertainty of the measured values is high, its predicted range of uncertainty is not adequate to explain the large gap between the predicted value of 8.03 s and the actual average of 20.22 s.  Reasons for error could be an underestimation of the actual intrinsic error involved with lab measurements.  One source of error that seems to stick out is the diameter of the drain hole, which was given as a ½ in which in turn was calculated to be 6.35e-3 m, this value was measured and found to be 3.68e-3, which is a large variance at that level.  Other reasons for the error may be that the height (h) of the water displaced was too large of a value.  With a smaller value the effects of the water draining may have been more accurately modeled by the equation for time derived from Bernoulli’s equation.  Interesting results though seem to be that there is only a slight variance between the measured uncertainty and the calculated uncertainty, which leads me to believe that there may have been a minor error in the recorded values of the calculated time.

Saturday, September 3, 2011

Fluid Statics (Buoyancy of Metal Cylinder)

Purpose
The objective of this experiment was to explore the different methods of measuring the buoyancy of an object in water.  The Buoyant force is described by Archimedes's principle which states when a body is completely or partially emerged in fluid, the fluid exerts an upward force on the body equal to the weight of the fluid displaced by the body.  

Method and Results:
Three separate measurements of the buoyant force were obtained by alternating methods.  

1.  In the underwater weighing method a metal cylinder was held in a cup of water of known volume while force probe was used to determine the tension needed to hold the object up.  The equation needed to determine the buoyant force was:

B= W- T

B= (0.229 +/- 0.006 N) -  (0.165 +/- 0.006 N) = 0.064 +/- 0.012 N

The Tension (T) was determined using the Force probe, the weight of the metal cylinder (W) was recorded with the force probe using statics.  


2.  In the Displaced Fluid Method Water was allowed to flow out of a cup that was filled to its brim.  This water was in turn weighed and multiplied by gravity to determine the weight of the water displaced. This method is a direct use of Archimedes's principle as it states the weight of the fluid displaced is equal to the bouffant force.

B=Ww
B=W=mg= 0.0657 +/- 0.006  N

3.  In the Volume of Object Method the dimensions of the metal cylinder were recorded and used to determine the volume.  This value was multiplied by the density of water and gravity to once again determine the weight of water displaced.

B=Vcrg
V=7.32 E-6 +/-  0.009 m^3
B=W= Vcrg = 0.0724 +/- 0.009 N


Conclusion:
Although the values for the buoyant force are precise the uncertainties for them are not.  This could be due to the fact that each of the three methods for determining buoyancy requires a unique amount of measurements and each measurement needed will typically raise the uncertainty of a result.

Values
avg 0.0674
range 0.0084
avg uncertanty 0.0072
uncertanty range 0.0114