Monday, December 12, 2011

Confirming Plank's Constant

Purpose:

The purpose of this experiment was to measure planks constant using the spectral lines of different colored LED’s.  The LED’s wave length was measured using the same system as used in the previous experiment.  The Voltage through the LED was measured and graphed with the frequency and the slope of that line was expected to be Plank’s constant.


Method:

Two rulers were set up in an L shape and at the end of one of the rulers was an LED with the gradient at the front of the ruler.  To the right of the LED was another ruler that was used to measure how far the spectral lines appeared to be from the source when looking through the gradient.  A measured Voltage was sent through the LED and the Spectral line were measured to determine the wavelength of the LED.  This was used in determining the frequency.


D (cm) L (cm) Wavelength (nm) Voltage (V)
Red 191.85 36.3 641.9 1.81
Orange 191.85 33.9 592.4 1.88
Green 191.85 31.8 529 2.48
Blue 191.85 28.4 475.6 2.58


The Energy was determined by multiplying the voltage with the charge of a electron.

E (J) 1/wavelength
Red 2.90E-19 1.56E+06
Orange 3.01E-19 1.67E+06
Green 3.97E-19 1.89E+06
Blue 4.13E-19 2.10E+06


h=qV/f

Using the relationship above plank's constant which is known to be 6.626E-34 was recorded as:

Red                 6.21E-34
Orange           5.94E-34
Green             7.00E-34
Blue                6.55E-34

Conclusion:

The average experimental value of h came out to be 6.43E-34.  This value when compared to the excepted plank's constant has an error percentage of 3.03% which is an acceptible verification of plank's constant.


Sunday, December 11, 2011

Line Spectra Lab


Purpose:

The purpose of this experiment was to measure the wavelength of the spectra of the light emitted from an unknown gas and use the spectra to determine the gas.  A gradient of known attributes was used to see the spectra.


Method:

Two rulers were set up in an L shape and at the end of one of the rulers was a light source with the gradient at the front of the ruler.  To the right of the light source was another ruler that was used to measure how far the spectral lines appeared to be from the source when looking through the gradient.


The target of the experiment was to determine the wavelength of the light emitted from a gas lamp.  To determine this we used a trigonometrically derived equation.


Where d is the spacing between the slits of the diffraction gradient, D is the distance to the spectral lines from the source and L is the distance from the gradient to the source.  

with d being measured as 
d=1.6E-6 m

The first unknown gas was measured with the following data being compiled.

D (m) L (m) Wavelength (measured)nm Wavelength (actual)nm
Red 0.75 1.57 690 690
Yellow 0.61 1.57 589 580
Green 0.54 1.57 535 545
Violet 0.42 1.57 439 435


Next we measured the Hydrogen spectrum. 

D (m) L (m) Wavelength (measured) Wavelength (actual)
Red 0.7 1.56 655 656
Blue 0.49 1.56 495 486
Violet 0.43 1.56 447 434


Conclusion:

This method of determining the wave length of light emitted from an excited gas proved to be quite accurate and simple method.  As the excited electrons in the gas raise and lower in shells they release quantized energy that can be calculated through the wavelength of the light.  The data gathered fits well into the uncertainty of the experiment.

Friday, November 18, 2011

Particle in a Box Lab

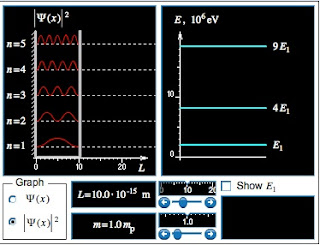
Question 1: Standing Waves
From your study of mechanical waves, what is the longest wavelength standing wave on a string of length L?


A:  The longest wavelength would be 2L.


Question 2: The de Broglie Relation
What is the momentum of the longest wavelength standing wave in a box of length L?


A:  Using de Broglie's equation p=h/2L.


Question 3: Ground State Energy
Assuming the particle is not traveling at relativistic speeds, determine an expression for the ground state energy.
Check your result by displaying the ground state energy.

A:  E= (h^2)/8mL

Question 4: Increasing L
If the size of the box is increased, will the ground state energy increase or decrease?


A:  As the size of the box increases the ground state energy decreases.


Question 5: The Correspondence Principle: Large Size
In the limit of a very large box, what will happen to the ground state energy and the spacing between allowed energy levels? Can this result explain why quantum effects are not noticable in everyday, macroscopic situations?

A:  As the ground state energy gets smaller the spacing becomes continuous.


Question 6: The Correspondence Principle: Large Mass
In the limit of a very massive particle, what will happen to the ground state energy and the spacing between allowed energy levels?

A:  With and increase in the mass we have a decrease in ground state energies.

Question 7: Ground State Probability
If a measurement is made of the particle's position while in the ground state, at what position is it most likely to be detected?


A:  At its ground state a particle is most likely to be in the center.


Question 8: Probability: Dependence on Mass and Size
The most likely position to detect the particle, when it is in the ground state, is in the center of the box. Does this observation depend on either the mass of the particle or the size of the box?


A:  No, if the mass of the particle or the size of the box increase in the ground state energy the electron is still most likely to be found in the center.


Question 9: Probability: Dependence on Energy Level
The most likely position to detect the particle, when it is in the ground state, is in the center of the box. Does this observation hold true at higher energy levels?


A:  Yes even if energy levels are higher the particle is still most likely in the center of the box.


Question 10: The Correspondence Principle: Large n
In the limit of large n, what will happen to the spacing between regions of high and low probability of detection? Does this agree with what is observed in everyday, macroscopic situations?


A:  At a high n the spacing between the nodes gets closer and closer tell the energy becomes continuous.


Wednesday, November 16, 2011

Wave Packet Programming Lab

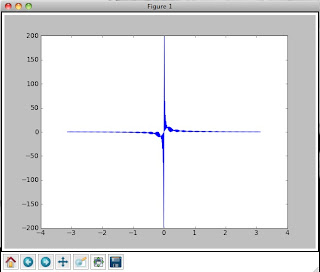
4 Sinusoid graph:
---------------------------------------------
from pylab import *
#Define constantsConstants
A=1 #Define the ampletude of the sin function
w=1 #sets the frequancey coefficient
#Calculation Loop: Note Nesting Carfully


for i in range(1,4):
    x = []
    sin_list = []
    for t in arange (-3.14, 3.14, 0.01):
        sine= A*sin(i*w*t)
        sin_list.append(sine)
        x.append(t)
    plot (x,sin_list)
show()


---------------------------------------

50 sinusoid graph:
--------------------------------------
from pylab import *
#Define constantsConstants
A=1 #Define the ampletude of the sin function
w=1 #sets the frequancey coefficient
#Calculation Loop: Note Nesting Carfully


for i in range(1,50):#every time the loop repeats this will change the harmonic
    x = [] # plots from -pi to +pi
    sin_list = [] #this includes the sine functions
    for t in arange (-3.14, 3.14, 0.01): # create tsh range of the graph and incriments
        sine= A*sin(i*w*t) #the function to be plotted
        sin_list.append(sine) # Adds the calculated vale from the sine function to the list appendex
        x.append(t)
    plot (x,sin_list)# plots values
show() #show the plot

----------------------------------------
Localized particle
---------------------------------------
from pylab import *
#Define constantsConstants
A=1 #Define the ampletude of the sin function
w=1 #sets the frequancey coefficient
Fourier_Series=[] #initialize the list of sine functions
#Calculate the harmonics of the sine functions

for i in range(1,300):#every time the loop repeats this will change the harmonic
    x = [] # plots from -pi to +pi
    sin_list = [] #this includes the sine functions
    for t in arange (-3.14, 3.14, 0.01): # create tsh range of the graph and incriments
        sine= A*sin(i*w*t) #the function to be plotted
        sin_list.append(sine) # Adds the calculated vale from the sine function to the list appendex
        x.append(t)
    #plot (x,sin_list)# plots values
    Fourier_Series.append(sin_list)

superposition = zeros(len(sin_list))

for function in Fourier_Series:
    for i in range(len(function)):
        superposition[i]+=function[i]
    
plot(x,superposition)

show()

--------------------------------------------
Envelope
-------------------------------------------
from pylab import *
#Define constantsConstants
A_list=[] #Define the amplitude of the sin function
w=1 #sets the frequancey coefficient
Fourier_Series=[] #initialize the list of sine functions
sigma = 1
coeff = 1
numberofharmonics=50
center = numberofharmonics/2
#Calculate the harmonics of the sine functions

for i in range(1,50):#every time the loop repeats this will change the harmonic
    x = [] # plots from -pi to +pi
    gauss = coeff*exp(-(i-center)**2/(2.*sigma**2))
    
    sin_list = [] #this includes the sine functions
    for t in arange (-3.14, 3.14, 0.01): # create tsh range of the graph and incriments
        sine= gauss*sin(i*w*t) #the function to be plotted
        sin_list.append(sine) # Adds the calculated vale from the sine function to the list appendex
        x.append(t)
    #plot(x,sin_list)# plots values
#show()

    Fourier_Series.append(sin_list)
superposition = zeros(len(sin_list))
for function in Fourier_Series:
    for i in range(len(function)):
        superposition[i]+=function[i]
plot(x,superposition)
show()

---------------------------------------------------
Wave packet
---------------------------------------------------
from pylab import *
#Define constantsConstants
w=1 #sets the frequancey coefficient
Fourier_Series=[] #initialize the list of sine functions
sigma = 10
coeff = 1
numberofharmonics=50
center = numberofharmonics/2
#Calculate the harmonics of the sine functions

for i in range(1,50):#every time the loop repeats this will change the harmonic
    x = [] # plots from -pi to +pi
    gauss = coeff*exp(-(i-center)**2/(2.*sigma**2))#Define the amplitude of the sin function
    sin_list = [] #this includes the sine functions
    for t in arange (-3.14, 3.14, 0.01): # create tsh range of the graph and incriments
        sine= gauss*sin(i*w*t) #the function to be plotted
        sin_list.append(sine) # Adds the calculated vale from the sine function to the list appendex
        x.append(t)
    #plot(x,sin_list)# plots values
#show()

    Fourier_Series.append(sin_list)
superposition = zeros(len(sin_list))
for function in Fourier_Series:
    for i in range(len(function)):
        superposition[i]+=function[i]
plot(x,superposition)
show()


--------------------------------------------------


Friday, November 11, 2011

Relativity Lab

Relativity of Time:

Question 1: Distance traveled by the light pulse
How does the distance traveled by the light pulse on the moving light clock compare to the distance traveled by the light pulse on the stationary light clock?


A:  The light on the moving light clock must travel a greater distance than the light on the stationary light clock.  Although they both go up and down, the moving light clock has a component vt in the direction of motion that must be factored in.


Question 2: Time interval required for light pulse travel, as measured on the earth
Given that the speed of the light pulse is independent of the speed of the light clock, how does the time interval for the light pulse to travel to the top mirror and back on the moving light clock compare to on the stationary light clock?


A:  From the stationary observer it appears as though the light takes longer to complete a cycle due to the fact that it has a larger distance to travel.


Question 3: Time interval required for light pulse travel, as measured on the light clock
Imagine yourself riding on the light clock. In your frame of reference, does the light pulse travel a larger distance when the clock is moving, and hence require a larger time interval to complete a single round trip?


A:  From the point of view of the moving observer the time taken for the journey is the same as if the light clock were stationary, this is due to the fact that from the moving observes point of view there is actually no extra distance traveled and the light appears to only go up and down the y axis.


Question 4: The effect of velocity on time dilation
Will the difference in light pulse travel time between the earth's timers and the light clock's timers increase, decrease, or stay the same as the velocity of the light clock is decreased?


A:  The faster the light clock moves the greater the difference between it and the stationary clock.


Question 5: The time dilation formula
Using the time dilation formula, predict how long it will take for the light pulse to travel back and forth between mirrors, as measured by an earth-bound observer, when the light clock has a Lorentz factor (γ) of 1.2.


A:  (1.2)(6.67E-6)= 8E-6 s


Question 6: The time dilation formula, one more time
If the time interval between departure and return of the light pulse is measured to be 7.45 µs by an earth-bound observer, what is the Lorentz factor of the light clock as it moves relative to the earth?


A: (7.45E-6)/(6.67E-6)=1.12


Relativity of Length:


Question 1: Round-trip time interval, as measured on the light clock
Imagine riding on the left end of the light clock. A pulse of light departs the left end, travels to the right end, reflects, and returns to the left end of the light clock. Does your measurement of this round-trip time interval depend on whether the light clock is moving or stationary relative to the earth?


A:  It does matter as if the light clock is moving it will take longer for the light to travel to the right end a very short time to return, this will make the total trip time seem longer.


Question 2: Round-trip time interval, as measured on the earth
Will the round-trip time interval for the light pulse as measured on the earth be longer, shorter, or the same as the time interval measured on the light clock?


A:  it will seem longer for reasons mentioned above.


Question 3: Why does the moving light clock shrink?
You have probably noticed that the length of the moving light clock is smaller than the length of the stationary light clock. Could the round-trip time interval as measured on the earth be equal to the product of the Lorentz factor and the proper time interval if the moving light clock were the same size as the stationary light clock?


A:  If the moving clock were the same size as the stationary clock then the Lorentz factor would not be valid.  The moving clock must shrink to uphold the Lorentz factor.


Question 4: The length contraction formula
A light clock is 1000 m long when measured at rest. How long would earth-bound observer's measure the clock to be if it had a Lorentz factor of 1.3 relative to the earth?


A: (1000)/1.3= 769 m


Tuesday, October 25, 2011

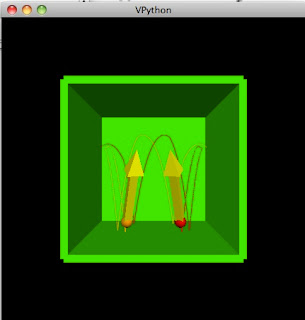
Python Tutorial

from visual.graph import *

#define values
ball = sphere(pos=(-5,2,-1), radius=.5, color=color.red)
ball2= sphere(pos=(5,2,-1), radius=.5, color=color.orange)
wallR = box(pos=(6,0,0), size=(.5,12,12), color=color.green)
wallL = box(pos=(-6,0,0), size=(.5,12,12), color=color.green)
wallF = box(pos=(0,0,-6), size=(12,12,.5), color=color.green)
wallT = box(pos=(0,6,0), size=(12,.5,12), color=color.green)
wallB = box(pos=(0,-6,0), size=(12,.5,12), color=color.green)
dt = 0.02


ball.velocity = vector(2,3,-5)
ball.trail = curve(color=ball.color)
bv = arrow(pos = ball.pos, axis = ball.velocity, color=color.yellow)

ball2.velocity = vector(-2,3,-5)
ball2.trail = curve(color=ball2.color)
bv2 = arrow(pos = ball2.pos, axis = ball2.velocity, color=color.yellow)

while(1==1):
    rate(50)
 
  
    ball.acceleration = vector(0,-9.81,0)
    ball.pos = ball.pos + ball.velocity*dt + .5*ball.acceleration*dt*dt
    ball.velocity = ball.velocity + ball.acceleration*dt

    ball2.acceleration = vector(0,-9.81,0)
    ball2.pos = ball2.pos + ball2.velocity*dt + .5*ball2.acceleration*dt*dt
    ball2.velocity = ball2.velocity + ball2.acceleration*dt

    if ball.x >= (wallR.x - .75):
        ball.velocity.x = -ball.velocity.x
    if ball.x <= (wallL.x + .75):
        ball.velocity.x = -ball.velocity.x
    if ball.y >= (wallT.y - .75):
        ball.velocity.y = -ball.velocity.y
    if ball.y <= (wallB.y + .75):
        ball.velocity.y = -ball.velocity.y
    if ball.z <= (wallF.z +.75):
        ball.velocity.z = -ball.velocity.z
    if ball.z >= 5.5:
        ball.velocity.z = -ball.velocity.z

    if ball2.x >= (wallR.x - .75):
        ball2.velocity.x = -ball2.velocity.x
    if ball2.x <= (wallL.x + .75):
        ball2.velocity.x = -ball2.velocity.x
    if ball2.y >= (wallT.y - .75):
        ball2.velocity.y = -ball2.velocity.y
    if ball2.y <= (wallB.y + .75):
        ball2.velocity.y = -ball2.velocity.y
    if ball2.z <= (wallF.z +.75):
        ball2.velocity.z = -ball2.velocity.z
    if ball2.z >= 5.5:
        ball2.velocity.z = -ball2.velocity.z

    if ball.pos.x == ball2.pos.x:
        ball.velocity.x= -ball.velocity.x
        ball2.velocity.x= -ball2.velocity.x
  
      
    bv.pos = ball.pos
    bv.axis = ball.velocity/2
    ball.trail.append(pos = ball.pos)
    bv2.pos = ball2.pos
    bv2.axis = ball2.velocity/2
    ball2.trail.append(pos = ball2.pos)
  
------------------------------------------------------------------

Diffraction Lab

Purpose:

The purpose of this lab was to test the diffraction of light against a compact disc.  A compact disc contains information by having small burns on the disk, these burns can be viewed by shining a lazar light onto the CD.  The equation used was:

y=mLR/2d

where y is distance from central maxima, m is number of minima, L is wavelength, R is distance from diffraction gradient, and d is distance between gratings which is our target variable in this experiment.

Method:

The experiment was assembled by using a standard compact disc and a laser with a wavelength of 670 nm +/- 20 nm.  Two sets of data were taken.  The first was at a distance of 2.00 m +/- .15 m.  At this distance the maxima were measured on the right of the central maxima and on the left of the central maxima.  To our surprise the two sides were different and one of the sides was also noted to be curved.  both sides were measured and charted.


right (cm) left (cm) average (cm) Uncertanty (cm)
m1 2.12 3.10 2.61 0.98
m2 4.70 5.50 5.10 0.80
m3 6.80 8.60 7.70 1.80
m4 8.60 11.10 9.85 2.50
m5 10.40 14.40 12.40 4.00


The varying values leads to a high uncertainty and makes the data less useful than desired.  Next we set up the experiment in a different way.  We place a white board close to the CD and place the Laser close to the CD as well.  By lowering the distance from grating to diffraction pattern we reduced the uncertainty of the data.  With a new R= 0.07 m +/- 0.015 m we got consistent data on both sides of the central maxima


average (cm) Uncertanty (cm)
m1 2.80 0.20
m2 4.20 0.40


Using our equation for diffraction grating we determined a value of d= 977.1 nm +/- 279.5 nm

Conclusion:

The value obtained for the distance between gratings was 977.1 nm +/- 279.5 nm.  The actual known value of the distance is around 1600 nm which is out of our uncertainty range and has an error percent of  21.5% from the furthest reaches of our uncertainty.  Although the data is on the same order of magnitude when uncertainty is taken into account, the actual results are not accurate at all.  Results may have been off due to having R be to small, if slightly larger measurements of minima distances would have been easier to get.

Thursday, October 6, 2011

Measuring Thickness of Human Hair Using Young's Method


Purpose:
This experiment was a recreation of the famous Young’s double slit experiment originally carried out in 1800 by Thomas Young.  The slight variation on the experiment was that a hair was used as the divider of the light source.  This added an additional easement to the experiment that gave it a bit more depth.  When the light was projected on a whiteboard an interference pattern was viewed, confirmation of lights wave like properties.  This pattern was measured in an attempt to confirm the Young’s double slit equation.

Method and Results:
A hear was plucked from one of the members of the lab group and this hear was measured for its thickness (d).  Next the hair was taped to the hole of an index card in such a manner that divided the hole punched circle evenly.  This card was set in place and a laser of known pre measured wavelength was focused through the hole.  A white board was placed at varying distances to easily view the interference pattern.  The distance from the index card to the board was measured (R).  Next the interference pattern was measure from 4 interference fringes (y).  These values were then used to confirm the thickness of the hair measured with the micrometer.

Trial
R (m)
y (m)
M
1
2.00
0.0765
4
2
1.68
0.0630
4
3
3.62
0.1100
4

Wavelength:  670 nm +/- 20 nm
Measured Thickness of hair:  0.0245 mm+/- 0.0015 mm

Calculated thickness:
Trial 1: 0.0701 mm +/-  0.0030 mm
Trial 2: 0.0715 mm +/-  0.0030 mm
Trial 3: 0.0882 mm +/-  0.0030 mm
            Average: 0.0766 mm +/- 0.0090 mm

Conclusion:
The thickness measured with the Young’s double slit experiment gave precise results and two of the three trials were within the measured uncertainty.  These values seem much more reliable than the micrometer measurement as most groups were having trouble getting measurements from the equipment.  This coupled with the precision of the Young’s method leads me to believe the diameter of the hair is the average of the Young’s result.

Tuesday, October 4, 2011

Real Image through a Lens Lab

Purpose:

The purpose of this lab was to explore the actions of light as it moves through a lens.  A light source was used to project a real image through a magnifying glass and on to a white board to view how the light was refracted and altered.

Method and Results:

A magnifying glass was chosen and this glass was measured for its focal point.  The method for the measurement was to use the suns light to focus a light rays onto the ground.  Due to the magnifying glass being a convex lens it is know that the point at which the light is focused through it from a far off object is at the focal point.  Three measurements were taken from the focal point on the ground to the lens.  These measurements were taken for an average and to determine the uncertainty of the method.

f1= 14.10 cm
f2= 15.80 cm
f3= 15.00 cm
favg= 14.97 cm +/- 1.70 cm


The magnifying glass was set up distances from the light source of known multiples of the average focal length.  A white board was placed behind the lens and adjusted in tell the image was focused.  The distance from the lens to the white board was measured as was the height of the real image.


Relative to f Object distance (cm) Image distance (cm) Object height (cm) Image height (cm) M Type of image
5f 74.85 23.5 3 1.30 0.433 inverted/reversed
4f 59.88 24.5 3 1.75 0.5833 inverted/reversed
3f 44.91 28.7 3 1.95 0.65 inverted/reversed
2f 29.94 44.5 3 5.20 1.733 inverted/reversed
1.5f 22.46 332.5 3 53.60 17.867 inverted/reversed


A measurement was taken at distance 0.5f but the image could not be focused.  The object and image distance were graphed and an inverse relationship was found.


The inverse of both values was then taken and a linear relationship was discovered.


Conclusion:


The absolute value of the slope of the graph is 0.7738 which is a value that is off from the expected value of one as this is the value of n in air.  this discrepancy could be explained by the large uncertainty involved in our measurement of the focal point as the uncertainty of 1.70 cm is a large value.  More likely though the % error of 22.6% is due to the low number of points measured and the arbitrary nature in which the focused real image was obtained.  These cupeled with the fact that there was not an adequate light experiment setup lead to much uncertainty.  


Concave Convex Mirrors

Purpose:

The Purpose of this experiment was to explore the image formed by both a convex and concave mirror.  Concave and convex mirrors are both considered spherical mirrors and both behave differently than a traditional plane mirror.  One of the most apparent differences is in the distortion of the height and distance of the image.


Method and Results:

Objects were held in from of both a concave and convex mirror at separate times.  The object was moved in front of the mirror and inspected at different distances and orientations.  Next ray diagrams were constructed form each of the mirrors.

Convex Mirror


With the convex mirror the focal point is located on the inside of the mirror and this is on the opposite side of the reflected light rays.  This leads for the image to be on the inside of the mirror leading to a virtual image.  The closer the object is to the mirror the larger the image will be to the extent that if the image is close to the mirror the image will be larger than the image.

S= 6.20 cm               s= 1.95 cm
H= 3.10 cm              h= 0.75 cm


Concave Mirror

With a concave mirror the results are different.  The main result is that the image is on the same side as the outgoing rays making them a real image.  This image is inverted so long as the distance of the object is grater than the focal point which in this type of mirror is located on the same side as the object.  


S= 2.50 cm                                s= 0.75 cm
H= 11.40 cm                             h= 3.30 cm

Conclusion:

In conclusion the behavior of light rays in spherical mirrors is much different than in plane mirrors.  The image can be virtual or real.  The image can be erect or inverted.  The height of the object can vary drastically.  a majority of these differences occur due to the addition of the center of curvature which in a plane mirror goes to infinity and is no longer important leading to a simplified equation for light ray behavior.

Sunday, September 25, 2011

Light Refraction Lab

Purpose:
The purpose of this experiment was to test the refraction of light through a class prism.  A light source was used with a circular protractor to measure the angle of refraction for the light source.


Method and Results:
A light source was set up with a focused beam of light.  A glass semi circle prism was set on a circular protractor and the light was focused into the prism at measured angles.  


First the light was incident to the strait diameter of the semicircle yielding these results.

theta i theta r sin(theta i) sin(theta r)
144 60 0.587 0.866
148 55 0.53 0.819
150 50 0.5 0.766
152 45 0.47 0.707
156 40 0.407 0.643
158 35 0.375 0.574
161 30 0.326 0.5
163 25 0.292 0.423
167 20 0.225 0.342
172 15 0.139 0.259


Next the light was focused incident to the arc of the semi circle giving data table # 2.

theta i theta r sin(theta i) sin(theta r)
124 30 0.829 0.5
135 25 0.707 0.423
149 20 0.515 0.342
152 15 0.469 0.259
167 10 0.225 0.174
174 5 0.105 0.087
180 0 0 0
190 -5 -0.174 -0.087
203 -10 -0.391 -0.174
211 -15 -0.515 -0.259


Conclusion:
When a graph of the two angles was taken, it was found to be linear, these results are not what was to be expected.  


A reason for both sets of theta vs. theta graphs incorrect equations is due to the fact that the results were not taken over a longer range of circular increments.  If the data was to be taken as every 10 degrees for 10 trials the results may have been less skewed.  The slope of the sin(O)1 vs sin(O)2 was taken to be the index of refraction which was 1.52 +/- .15. 

Sunday, September 18, 2011

Harmonic Overtones Lab


Method and Results:
Using a Pasco Variable Wave Driver and a Pasco Student Function Generator standing waves were created of known frequency on a string (f).  


The other end of the string was attached to a pulley and weighed down with known mass (M).  This mass (M) was multiplied by gravity to determine the tension on the string (T).  The total length of the string was measured (L) and the amount of nodes, (n), created in the standing wave were recorded with respect to frequency.  


The mass of the string was recorded and divided by its length to determine the mass per unit length (m).  This information was used to determine the wavelength of the wave at certain frequency. 

frequency muew Tension nodes Velocity Wavelength
16.0 1.88E-03 1.95902 2 37.5565 2.35
32.0 1.88E-03 1.95902 3 37.5565 1.17
46.0 1.88E-03 1.95902 4 37.5565 0.816
63.0 1.88E-03 1.95902 5 37.5565 0.596
76.0 1.88E-03 1.95902 6 37.5565 0.494
109.0 1.88E-03 1.95902 8 37.5565 0.345
frequency muew Tension nodes Velocity Wavelength
27.0 1.88E-03 0.98196 2 22.8543 0.846
32.0 1.88E-03 0.98196 4 22.8543 0.714
54.0 1.88E-03 0.98196 6 22.8543 0.423
     
frequency muew Tension nodes Velocity Wavelength
15.0 1.88E-03 3.92 2 45.663 3.04
29.4 1.88E-03 3.92 3 45.663 1.55
44.0 1.88E-03 3.92 4 45.663 1.04
54.4 1.88E-03 3.92 5 45.663 0.839
72.3 1.88E-03 3.92 6 45.663 0.632
100.3 1.88E-03 3.92 7 45.663 0.455


Conclusion: 
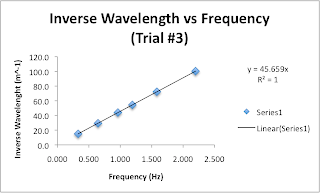
All data obtained was graphed and these graphs produced perfect linear equations when the inverse wavelength was taken and plotter with respect to the frequency. 


The slopes of each of these lines are the velocities of the waves on their respective strings.   When using a string with the same mass per length the frequency to obtain the same harmonic in different trials is directly proportional to the hanging mass used.